Harris County Judge Ed Emmett’s Post-Harvey Plan

[This is verbatim from the document provided by his office. Bold text added to help identify the key issue addressed in each suggestion.]

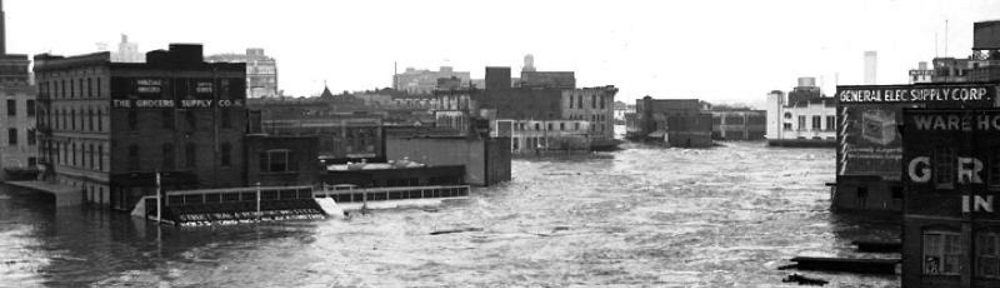
Two months ago, the remnants of Hurricane Harvey dumped unprecedented amounts of rain on Southeast Texas, including Harris County. People died, homes and businesses flooded, families were displaced and our lives changed.

Harvey was the worst flood in our history, but Harvey was not a singular event. It followed two other major rain events in recent years. This area has seen three of these so-called 500-year rains in the past two years. Either our definition of a 500-year rain needs updating or we can hope that we are safe for the next 1,500 years. Obviously, we cannot assume the latter.

Following Harvey, government officials, academics, private institutions and the general public have all weighed in with ideas of what our area needs to do to protect life and property from future floods. Special committees have been formed, and significant amounts of money have been committed to finding solutions.

However, now is not the time for a piecemeal approach. The sense of urgency created by Harvey will fade, so we must quickly commit ourselves to a comprehensive plan to redefine Harris County and the surrounding region as a global model for living and working in a flood-prone area.

I do not pretend to have all the right answers, nor do I see myself as an expert in flood control. My purpose today is to present a broad vision of what is needed and to challenge those involved in seeking solutions to think boldly. There is a general rule in politics that you should focus on fewer, narrowly defined items, since the more ideas that are presented, the more people will disagree with something. Harvey should make all of us suspend politics as usual and take ownership of flood control.

As county judge, I am the Director of Emergency Management. One thing I know for sure is that the best time to manage an emergency is before it happens. With that in mind, I offer the following suggestions.

Rivers, bayous, creeks and flood mitigation areas should be viewed as positive features and treated as preserves or recreational and tourist areas. We should turn a vulnerability into an asset. That should be our overriding vision. With that vision in mind, there are numerous specific ideas that need to be present.

  1. Create a regional flood control/water management organization similar to the Transportation Policy Council at the Houston-Galveston Area Council. This will allow for multi-county coordination of flood control and water management.
  2. FEMA flood plain maps need to be revised immediately to reflect the impact of Harvey. Development rules should focus on restricting development in the 500-year flood plain instead of the 100-year flood plain — or the 100 year flood plain needs to be vastly redefined and updated.
  3. A third reservoir should be built to protect the west and northwest sections of Harris County. Rather than waiting on federal funds, the reservoir should be funded by the State of Texas’ “rainy day fund.” The reservoir should be part of a larger project to create a state or national park for the Katy Prairie.
  4. The U.S. Army Corps of Engineers should immediately fund the four Harris County Flood Control District projects that are now ready for completion. Those four are Brays Bayou, White Oak Bayou, Hunting Bayou and Clear Creek. New flood maps showing the impact of these projects should be released so homeowners will know if their property will remain flood prone.
  5. Old watersheds in developed areas in Harris County should be identified. For example, those areas downstream from Addicks Reservoir need to know where an “uncontrolled release” over the spillway would flow.
  6. The Harris County Office of Emergency Management, working with municipalities and special districts, should develop a state-of-the-art flood warning system and localized evacuation plans. Such plans should use recognized volunteer organizations to assist first responders. The Harris County Sheriff’s Office and the Community Emergency Response Teams should have a defined water rescue effort featuring private boats and high-water vehicles.
  7. Lake Houston and Lake Conroe should be converted to serve as Flood Control facilities in addition to serving as water supplies. Lake Houston should be restored to maximum storage capacity, and the San Jacinto River Authority should create retention/detention capacity upstream of Lake Houston. And the San Jacinto River Authority should have representation from Harris County.
  8. The Harris County Emergency Operations Center should be expanded to assist emergency operations for smaller surrounding counties.
  9. The roles and responsibilities of municipal utility districts and other special districts should be clarified to include flood control and storm water management, in cooperation with the Harris County Flood Control District. Existing districts should be studied for untapped capacity, and new districts developed with flood control in mind. Until a true 100-year flood level is defined, the 500-year level should be used for detention purposes.
  10. All underpasses that have the potential for drowning should be identified and equipped with automatic barriers or be part of a comprehensive manual plan for closures. In addition, vehicle manufacturers should be encouraged to develop technology to detect high water.
  11. The Harris County Flood Control District should develop comprehensive plans for every major watershed in Harris County, with immediate attention given to the entire length of Buffalo Bayou and to plans to divert storm water around downtown Houston, either through a canal or tunnel system.
  12. Federal, state and local governments should implement a buyout and/or elevation program for all homes located in the 100-year flood plain or that have flooded repeatedly. Such a buyout/elevation program should use traditional government funding and private funding, such as social impact bonds.
  13. The State of Texas should institute clear rules for approval of development plats in unincorporated areas, specifically those areas in the extraterritorial jurisdiction of a city. Additionally, there should be clear requirements for disclosure of flood risk to homebuyers and renters.
  14. The U.S. Army Corps of Engineers should restore the dams and detention areas of Addicks and Barker reservoirs to first-class condition including, if necessary, removing dirt and vegetation within the reservoirs.
  15. Given the population of unincorporated Harris County and the restrictions on incorporation and annexation, Harris County should be allowed some ordinance making power and should receive a portion of the sales tax collected in unincorporated areas. To continue to exclusively rely on the property tax is fundamentally unfair and unsustainable.

Post-Harvey Decisions Should be Risk-Based

In this “post-Harvey” period there are many suggestions about how best to spend the $10 or $20 billion we hope to get from the federal government, the state of Texas, local property taxes, potentially new sales tax collections, and (of course) cash proceeds from new local government bond sales.

For example, some folks are suggesting we should spend $6 billion to buy out homes in the western fringe of the Addicks and Barker flood pools and along Buffalo Bayou from Highway 6 to downtown, and channelize or modify the bayou corridor so it can convey 15,000 cubic feet per second. Others are pushing for the so called coastal spine to protect the region from storm surge.  Still others are suggesting that we build a third flood control reservoir in the Cypress Creek area.

I’m concerned that we are letting our emotions and a few cognitive biases harm our decision-making. Our emotions are telling us that flooding is terrible. People’s homes were destroyed. Their lives were horribly disrupted.  Photo albums destroyed.  Mold grew in bedrooms and living rooms. People died. This high level of emotion impacts decision making.  This high level of emotion increases our willingness to pay for projects that will (supposedly) cost-effectively reduce flood risks and damages. This is known as the “affect heuristic” cognitive bias, which basically means emotions can take over decision-making.

In addition, the “availability heuristic” cognitive bias, makes us all feel that flooding has a much higher likelihood of occurring in the near future if a flooding event has happened recently, regardless of the mathematical probability of the future occurrence.  A vivid example of this relates to how we perceive the risk of dying from a shark attack compared to the risk of dying from a falling airplane part.  Most people mistakenly believe that a shark death is more likely than a death from an airplane part because stories about shark attacks are widely reported and deaths from airplane parts are not.  What we hear about or experience recently is weighted more heavily in decision-making.

To avoid falling into the trap of these and other cognitive distortions we should decide how best to use post-Harvey funds using a risk-based decision making framework.  Here’s how I think it should work.

We need to think about potential projects in two distinct ways.  First, we need to think about the risk of a particular flooding event being addressed (over an appropriate period of time) and, second, we need to think about the consequence of that particular event occurring at any point in time. To help illustrate this approach we will consider two hypothetical projects, each with their own risk level, consequence, and cost.

But first we need to talk a bit more about risk and probability.  I created a graph that displays an array of various risk levels that we will use to help make the best decision.

The graph was constructed using basic probability calculations and it shows the probability of various rainfall events being exceeded during various time periods.  The vertical axis shows the probability from 0% chance to 100% chance.  The horizontal axis shows various time periods ranging from 1 to 10 to 10,000 years. It is plotted using a log scale, which allows us to see a very long period of time in a reasonable graph width. The various colored lines illustrate the probability of a particular 24-hour rain event being exceeded during any time period (duration) of interest.  The smaller events are much more common. The larger events are less common.  By examining the red line (13.2 inches in 24-hours) you can see that the likelihood of that storm falling on your home during your 30-year mortgage is about 26%.

The important thing to notice about this chart is that the longer we are willing to wait, the more likely any storm event becomes.  Let’s take a look at the very rare 18.9 inch rain storm in light blue. Over a 1 year time period we feel safe, because that much rain only has a 0.2% of happening during that time period. But the likelihood of that much rain falling on your home during your 30 year mortgage is about 6%. The chance of that storm hitting your home during 250 years is about 50%. So the crazy thing is that ALL of Houston has a non-zero probability of getting hit with a Harvey type storm or larger. It’s just a matter of time and the longer we wait the more certain the storm becomes. All of the curves eventually hit 100%.

These curves describe the risk of a certain rainfall depth hitting a certain location. Another similar set of curves could be created to illustrate the risk standing or flowing water achieving a certain elevation as a result of runoff from a rain event. This could be from bayou flooding, inundation of a low area, coastal surge, or reservoir pools filling up.

Ok, back to our two hypothetical projects. Here are the estimated or calculated facts about each of the projects. In real life all of this information would be estimated or calculated using engineering principles, computer models, construction cost estimating techniques, appraised property values, land values, and other sources and methods.

Project One – Conveyance Improvements: 

  • Description: Acquire land and enlarge bayou channel to increase the channel’s conveyance capacity.
  • Design Basis: Improve conveyance of stormwater runoff. Change stormwater carrying capacity to handle runoff from a 9.6 inch storm (4% annual chance) to 13.2 inch storm (1% annual chance).
  • Cost: $450 million
  • Benefit: Reduces flooding risk for 1,350 structures worth $675 million from a 9.6 inch storm (4% annual chance) to 13.2 inch storm (1% annual chance).

Project Two – Buyouts: 

  • Description: Acquire land, demolish structures, regrade land to provide detention, and re-landscape to make park area.
  • Design Basis: Remove home from high risk area which floods from 6.2 inches of rain (20% annual chance of flooding).
  • Cost: $720 million
  • Benefit: Reduces flooding risk for 1,350 structures worth $675 million from 4% per year (rain depth of 9.6 inches) to 0% forever.

Let’s look at each project from a benefit / cost perspective, while factoring in the cumulative risks.

Before Project One the risk of loss over 100 years can be determined from the graph by finding the intersection of the 9.6 inches curve with the 100 year line. This risk is 98%. The value of the loss (the consequence) is $675 million in present dollars. Multiplying the risk times the consequence provides the risk weighted loss for a 100 year period, which, in this case is $661.5 million.

After Project One the risk of loss over 100 years can be determined from the graph by finding the intersection of the 13.2 inches curve with the 100 year line. This risk is 63.5%. The value of the loss (the consequence) is still $675 million in present dollars. Multiplying the risk times the consequence provides the risk weighted loss for a 100 year period, which, in this case is $428.6 million.

Project One reduces the risk weighted loss by the difference between $661.5 million and $428.6 million. This reduction is the project benefit, which equals $232.9 million. The benefit to cost ratio is calculated by dividing the risk weighted benefit of $232.9 million by the project cost of $450 million. For this project the benefit to cost ratio is 0.52, which would not justify doing the project. Most project sponsors would only move forward if the benefit / cost ratio was greater than 1.0.

Now let’s look at Project Two.

Before Project Two the risk of loss over 100 years can be determined by multiplying the 20 year risk weighted loss by five. The 20 year risk can be obtained from the graph by finding the intersection of the 6.2 inches curve with the 20 year line. This risk is 99%. The value of the loss (the consequence) is $675 million in present dollars. Multiplying the risk times the consequence provides the risk weighted loss for a 20 year period, which, in this case is $668.3 million. Multiplying this by five, provides the 100 year risk weighted loss of $3.34 billion. (This assumes that the homes are repeatedly rebuilt and flooded.)

After Project Two the risk of loss over 20 years is zero because the structures are gone. The value of the loss (the consequence) is also zero because the structures are gone. This means the 100 year risk weighted loss is also zero.

Project Two reduces the risk weighted loss by the difference between $3.34 billion and $0.00. This reduction is the project benefit, which equals $3.34 billion. The benefit to cost ratio is calculated by dividing the risk weighted benefit of $3.34 billion by the cost of $720 million. This division yields a benefit to cost ratio of 4.6, which is an excellent ratio which indicates the project should proceed.

These two examples are admittedly simplistic, but we really need to use the methods illustrated to make smart decisions.  Let’s use the change in the risk weighted loss (pre to post project) to derive the project benefit value. Let’s compare that to the project cost.  Let’s calculate the project benefit to cost ratio over an appropriate time frame. Let’s do the projects with benefit to cost ratios of more than 1.0.

The 1940 “Definite Plan”

In June 1940 the United States Army Corps of Engineers released its Flood Protection Plan for Houston (Buffalo Bayou). I was able to find the original “Definite Project Report” and the associated drawings at the Rice University library.  This post provides some highlights from the documents.

I’ve posted the plan overview before, but its worth reposting here for context.  The green items are levees which form flood damage reduction reservoirs; the blue items are canals or channels; and the yellow text provides identification labels.

The Design Storm

The Corps reviewed a number of different “storms of record” and decided to use a design storm created by combining two of the worst-case scenarios they had seen up to that point.  They derived the design storm by taking the total depths of rain observed from June 27 to July 1, 1899 at Hearne, Texas and combining it with the rainfall intensities (inches per hour) observed in September 9-10, 1921 at Taylor, Texas.  They then placed this hypothetical worst-case storm directly over the planned reservoirs and facilities.

The Hearne storm produced 31.4 inches of rain in 3 days and the average depth of rain over 1,000 square miles was 25.8 inches.  The Taylor storm produced intensities ranging from 4.4 to 0.44 inch per hour.

The combination of these two events is depicted in the graphic below, which shows the hypothetical cumulative rainfall in inches vs. time for the design storm.

The design storm has the total rainfall amount (the horizontal end of the curve in the upper right) of the Hearne event coupled with the crazy steep slope, indicating high rainfall intensity (from 36 to 42 hours) of the Taylor event.  Yikes.

The Design Storm Runoff

To size reservoirs and channels the Corps needed to convert the rainfall depth to actual runoff rates and volumes. This is critical to determining how much of the rain falling from the sky actually runs off and either flows harmlessly around homes and businesses or inundates them.

The Corps conservatively assumed that 90% of the rainfall from the design storm described above would runoff.  To estimate the runoff flowing to each element of the overall plan, the design storm was then moved to be directly above each element.  Runoff timing, total volume, and flow rates (depicted in curves called hydrographs) were estimated using Franklin P. Snyder’s Synthetic Unit Graphs, published in the Transactions of the American Geophysical Union (1938).

Runoff hydrographs for each of the key definite plan elements are presented below.  Note that “second-feet” is equivalent to the flowrate expressed in “cubic feet per second.”  There are about 7.48 gallons in each cubic foot, so you can multiply by 7.48 to get gallons per second and then by 60 to get gallons per minute.  Also, an “acre-foot” is a volume measurement. It is 1 acre of area covered by 1 foot of water or about 325,829 gallons.

Definite Plan Elements

The Corps devised the definite plan to accommodate the design storm and the predicted runoff described above.  The definite plan included the following elements:

  • White Oak Reservoir
  • Brickhouse Gully Bypass Channel
  • North Canal
  • Cypress Creek Levee
  • Addicks Reservoir
  • Barker Reservoir
  • Rectification of Buffalo Bayou Above South Canal
  • South Canal
  • Improvement of Buffalo Bayou Through City

A few details of each of these plan elements are provided below.

White Oak Reservoir

  • Peak Design Inflow:                30,800 cubic feet per second
  • Total Design Inflow:                103,900 acre-feet
  • Levee Length:                         4.7 miles
  • Levee Max. Height:                 35 feet
  • Levee Max. Elevation:            90 feet above mean sea level
  • Storage:                                  24,400 acre-feet
  • Max. Pool Elevation:               85 feet above mean sea level

Brickhouse Gully Bypass Channel

  • Channel Length:                     1.9 miles
  • Lining:                                     Grass / Rip Rap in Selected Locations
  • Top Width:                               From 70 to 100 feet
  • Bottom Width:                         6 feet
  • Side Slopes:                            2 to 1
  • Depth:                                      From 10 to 25 feet
  • Conveyance:                           1,500 cubic feet per second

North Canal

  • Channel Length:                     20 miles
  • Lining:                                     Concrete Paving
  • Top Width:                               From 140 to 200 feet
  • Bottom Width:                         25 feet
  • Side Slopes:                            2 to 1
  • Depth:                                     From 28 to 38 feet
  • Conveyance:                           22,000 cubic feet per second

Cypress Creek Levee

  • Levee Length:                         14.9 miles
  • Levee Max. Height:                 12 feet
  • Levee Max. Elevation:             180 feet above mean sea level
  • Top Width:                               10 feet
  • Max. Bottom Width:                 82 feet
  • Side Slopes:                            3 to 1

Addicks & Barker Reservoir System (Combined)

  • Max. Combined Outflow:15,000 cubic feet per second (based on navigation in the Houston Ship Channel)
  • Release Conduits: Four 8 feet diameter (Addicks); Two gated “spare” conduits of equal size (Addicks); Five 8 feet diameter (Barker); Two gated “spare” conduits of equal size (Barker)

 Addicks Reservoir

  • Drainage Area:                         134 square miles
  • Peak Design Inflow:                  50,500 cubic feet per second
  • Levee Length:                          10.4 miles
  • Levee Max. Height:                  43 feet
  • Levee Max. Elevation:             115 feet above mean sea level
  • Max. Pool Elevation:                108.3 feet above mean sea level
  • Design Storage:                       134,000 acre-feet

Barker Reservoir

  • Drainage Area:                        152.8 square miles
  • Peak Design Inflow:                 40,300 cubic feet per second
  • Levee Length:                          13.8 miles
  • Levee Max. Height:                  37 feet
  • Levee Max. Elevation:             109 feet above mean sea level
  • Max. Pool Elevation:                101.7 feet above mean sea level
  • Design Storage:                       135,800 acre-feet

Rectification of South Mayde and Buffalo Bayou Above South Canal

  • Channel Length:                     7.2  miles
  • Lining:                                     Grass / Rip Rap in Selected Locations
  • Top Width:                              From 140 to 200 feet
  • Bottom Width:                       15 feet
  • Side Slopes:                            3 to 1
  • Depth:                                     From 5 to 22 feet
  • Conveyance:                           15,000 cubic feet per second

South Canal

  • Channel Length:                      39.2 miles
  • Lining:                                     Concrete Paving
  • Top Width:                               From 120 to 270 feet
  • Bottom Width:                          From 30 to 163 feet
  • Side Slopes:                            2 to 1
  • Depth:                                      From 16 to 42 feet
  • Max. Conveyance:                  15,000 cubic feet per second (above Brays Bayou)
  • Max. Conveyance:                  28,800 cubic feet per second (below Middle Bayou)

Total Cost

The total cost of all plan elements, plus utility work and other associated details was $13,243,700 (in 1940 dollars).

If you are interested in reading more from the 1940 Definite Plan, I’ve made a scan of it available here.

Hydrologically Invisible Developments, Again

My crazy idea about land development projects being “hydrologically invisible” is featured on the Texas Living Waters Project blog. Shout out to Keiji Asakura and Abigail Phillips of Asakura Robinson for doing the rendering of my wacky idea.

Check out the post here: http://texaslivingwaters.org/natural-drainage-low-impact-development-houston/

Don’t Throw the Opportunity Baby Out with the Stormwater

[Reposting a worthwhile white paper prepared by Wendell Cox and Tory Gattis, with the Center for Opportunity Urbanism, that provides some valuable context to support informed decision-making during our post-Harvey policy discussions.

My one quibble with this paper relates to their lack of precision in describing how current detention requirements work. They state that our detention regulations “require no net increase in runoff from new developments.” It would be more precise to say that Harris County detention regulations generally restrict the flow rate of runoff leaving the site to the pre-development flow rate, but they don’t generally restrict the total amount (volume) of runoff leaving the site. The City of Houston’s detention regulations are not based on runoff volume or rates, but rather on the site’s imperviousness.]

In the aftermath of Hurricane Harvey, and the disastrous flooding, Houston has come under extreme scrutiny. Some in the global, national as well as local media assaulted the area’s flood control system and its development model, criticisms that were echoed by some in the local area.

Much of the current debate starts from a firm misunderstanding of the region’s realities. This could lead to policies that ultimately undermine the keys that have propelled the region’s success. Below is a primer to inform future discussions of Houston’s future trajectory.

Did Harvey reflect Houston’s failure or a remarkable resiliency?

Harvey was a remarkable event for which there is little precedent. The Harris County Flood Control District estimates the four-day rainfall from Hurricane Harvey to be a once in 500 to 40,000 year flooding event. Whether such events are more likely in the future, the region’s systems worked remarkably well, although they should be bolstered considerably in the future.

Read more…